Maps & Spatial Thinking
Maps are one of humanity's oldest and most powerful tools for understanding the world. Spatial thinking is the ability to understand, analyze, and visualize the relationships between objects, locations, and spaces.
This guide covers map types, latitude & longitude, scale, projections, GIS and modern tools, and spatial analysis skills — plus an interactive globe and practice quiz.
1Introduction
From ancient cave paintings to today's interactive digital displays, maps have always helped us visualize places, plan journeys, and make sense of our surroundings. Maps and spatial thinking are essential in navigation, urban planning, disaster response, environmental monitoring, business logistics, and everyday phone apps.
Imagine opening a map app on your phone — within seconds, you can see your exact location, plan a route, check traffic, and find nearby restaurants. Behind that simple interface are centuries of mapmaking science combined with cutting-edge satellite and computer technology.
2Key Definitions
A symbolic representation of features of a place, drawn on a flat surface
The art, science, and technology of making maps
Ability to understand and visualize relationships between locations and spaces
Precise spot using coordinates (latitude & longitude)
Position described in relation to another place
Ratio between distance on the map and actual distance on the ground
Explains symbols, colors, and patterns used on a map
Symbol showing cardinal and intermediate directions
Lines (parallels) measuring N/S of the Equator (0°-90°)
Lines (meridians) measuring E/W of the Prime Meridian (0°-180°)
Method of representing 3D Earth on a 2D flat map — always distorts something
Shows general features: political, physical, road, topographic
Shows specific data: choropleth, dot density, flow, cartogram
Line on a topographic map connecting points of equal elevation
Geographic Information Systems — layered computer-based spatial analysis
Global Positioning System — satellite network for precise location
Gathering data about Earth without direct contact (satellites, drones)
Personal, internal representation of places based on experience
Half of the Earth: Northern/Southern or Eastern/Western
Unavoidable alteration of shape, area, distance, or direction on a flat map
3Types of Maps
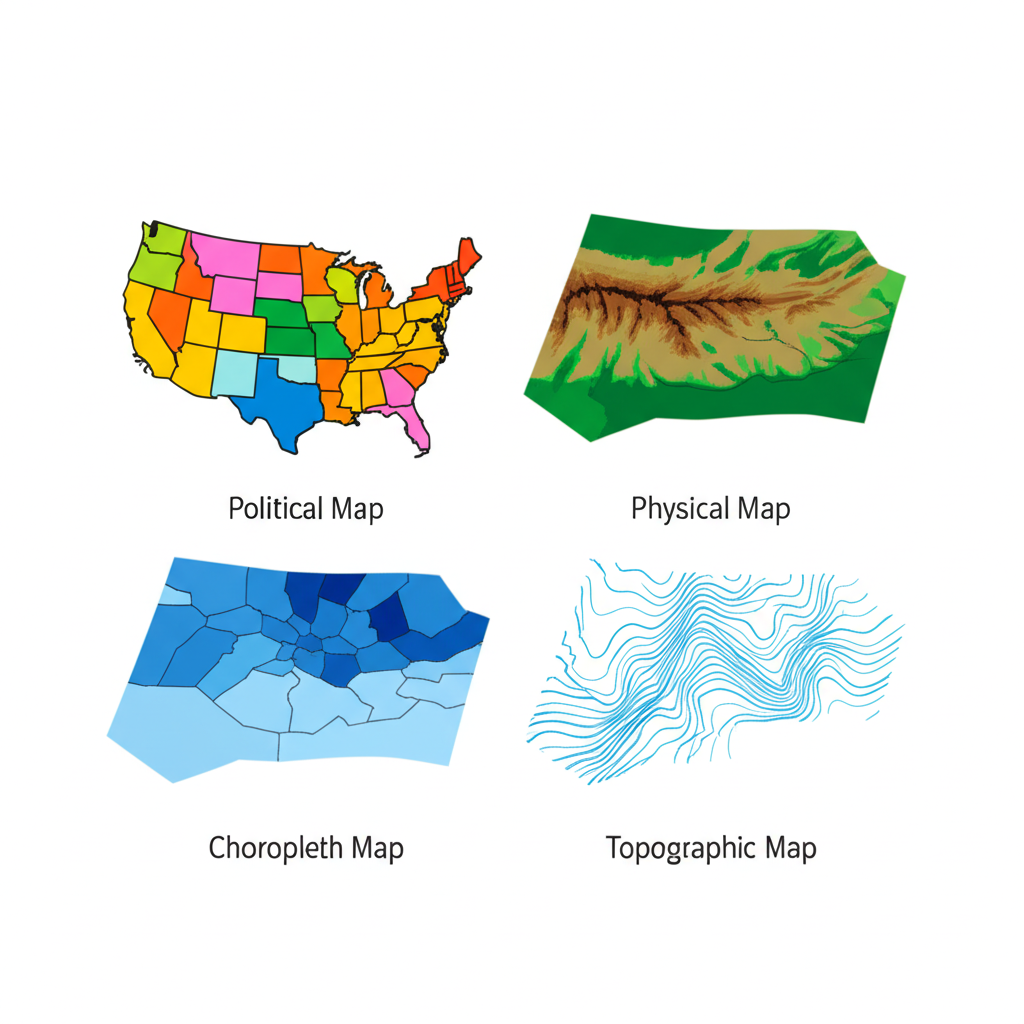
Reference Maps
Show general geographic features and locations:
Countries, states, cities, borders — different colors for different political units
Natural features — mountains, rivers, elevation using color shading (green lowlands to brown mountains)
Transportation networks — highways, streets, points of interest
Elevation and relief using contour lines — close lines = steep, far apart = gentle
Thematic Maps
Show specific data or themes about an area:
Areas shaded/colored to represent data values (e.g., population density by state)
Dots represent quantities (e.g., each dot = 1,000 people) — density shows concentration
Arrows/lines show movement — migration, trade routes, wind patterns; thickness = quantity
Symbols (circles, squares) scaled to data values at specific locations
Area distorted to reflect data rather than actual land area (e.g., countries sized by population)
How to Read a Map
Always check these key elements:
- Title — subject and purpose of the map
- Legend/Key — meaning of symbols, colors, and patterns
- Scale — relationship between map distance and real distance
- Compass Rose — orientation (N, S, E, W)
- Labels — names of places and features
- Source — where the information came from
4Latitude & Longitude
Latitude and longitude form the global coordinate system — a grid that allows us to pinpoint the absolute location of any place on Earth.
Latitude & Longitude — Interactive Globe
Click any labeled line on the globe to learn more about it
Latitude Lines
Longitude Lines
Click a line on the globe or a label to see details
Latitude (Parallels)
- Measures N/S of the Equator
- Lines run east-west (horizontal)
- Range: 0° to 90°N or 90°S
- Key lines: Equator, Tropics, Circles
- Always listed first in coordinates
Longitude (Meridians)
- Measures E/W of the Prime Meridian
- Lines run north-south (vertical)
- Range: 0° to 180°E or 180°W
- Converge at the poles (not parallel)
- Listed second in coordinates
Hemispheres
Northern/Southern: divided by the Equator. Eastern/Western: divided by the Prime Meridian and International Date Line.
Reading coordinates: Latitude always first — e.g., New York City is approximately 40°N, 74°W (40 degrees north of the Equator, 74 degrees west of the Prime Meridian).
5Map Scale
Map scale shows the relationship between distance on the map and distance in the real world.
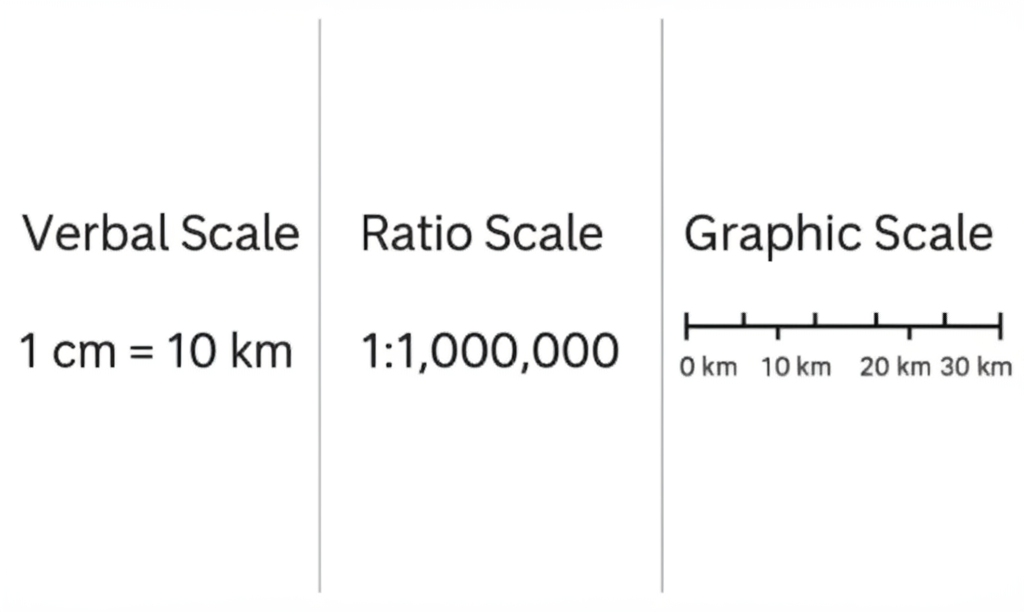
Three Types of Scale
Expresses the relationship in words
1 unit on the map = 100,000 of the same units in reality
Lets you directly measure and convert distances
Large Scale vs. Small Scale
Large Scale (e.g., 1:10,000)
- Shows a small area
- Lots of detail
- Larger fraction (1/10,000)
- Example: city map, campus map
Small Scale (e.g., 1:10,000,000)
- Shows a large area
- Less detail
- Smaller fraction (1/10,000,000)
- Example: world map, continent map
6Map Projections
Earth is a 3D sphere; maps are 2D flat surfaces. Every projection distorts at least one of four properties: shape, area, distance, or direction. No perfect projection exists — the choice depends on the map's purpose.
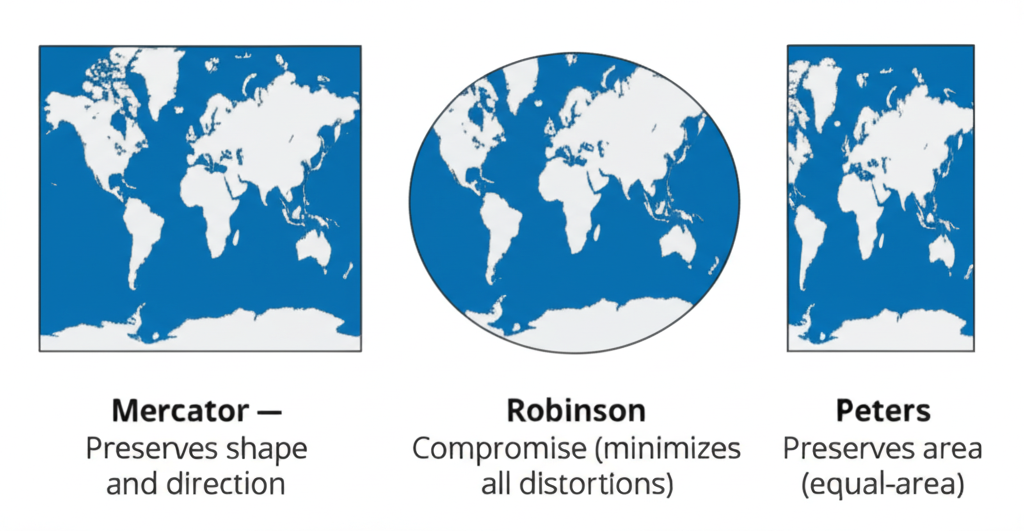
Mercator
Greenland appears as large as Africa, but Africa is actually 14x bigger.
Robinson
Looks aesthetically balanced — the most commonly used world map projection.
Peters (Gall-Peters)
Accurately shows that Africa is much larger than it appears on Mercator.
Conic
Made by placing a cone over the globe, touching along a line of latitude.
Azimuthal
Made by placing a flat plane tangent to the globe at a single point.
7Geographic Tools & Technology
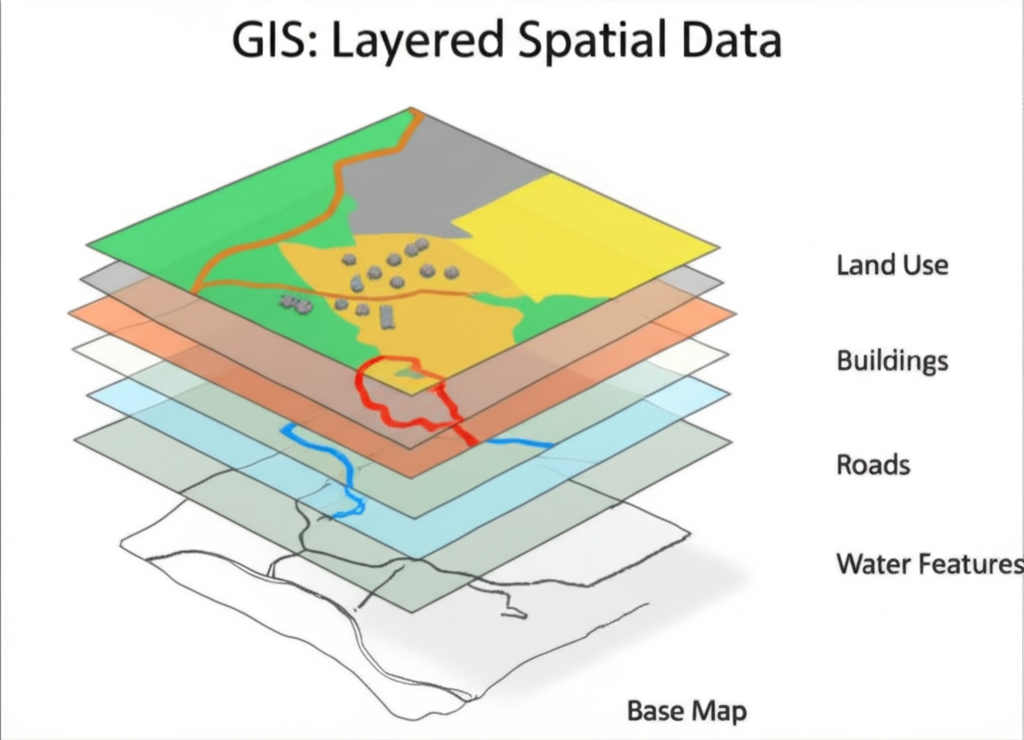
GIS (Geographic Information Systems)
What: Computer systems that capture, store, analyze, and display spatial data in layers.
How: Data organized into transparent layers (roads, rivers, population, land use) that can be combined to reveal patterns.
Uses: Urban planning, environmental monitoring, disease tracking, disaster management, business analytics.
GPS (Global Positioning System)
What: Satellite-based navigation system providing precise location anywhere on Earth.
How: A network of ~30 satellites transmits signals. Your receiver calculates location via trilateration from 4+ satellites.
Uses: Car navigation, hiking, surveying, tracking, search & rescue, precision agriculture.
Remote Sensing
What: Gathering data about Earth's surface without direct contact.
How: Uses satellites, aircraft, and drones to capture images and sensor data from above.
Uses: Weather monitoring, land use change, deforestation tracking, military intelligence.
Mental Maps
Mental maps are personal, internal representations of places based on experience, memory, and perception. Everyone's mental map is different and often includes landmarks, familiar routes, and areas of importance — they're subjective and often distorted compared to actual geography.
8Spatial Thinking Skills
Identifying clusters, trends, and distributions on maps — e.g., noticing cities cluster along coastlines and rivers.
Proximity (how close), connectivity (how linked), adjacency (sharing borders), containment (within another area).
Understanding how zooming in/out changes visible detail and the area represented.
Using cardinal/intermediate directions and landmarks to describe locations and navigate.
Comparing maps from different periods to see how features, land use, or populations have changed.
9Memory Aids
"Lat is flat, Long is tall"
Latitude lines run flat (east-west, like ladder rungs) and are listed first. Longitude lines run tall (north-south, like ladder sides).
"Large Scale = Large Fraction = Lots of Detail, Small Area"
1/10,000 is a larger fraction than 1/10,000,000. Larger fraction → more detail, smaller area shown.
"Never Eat Soggy Waffles"
North, East, South, West — going clockwise from the top of a compass rose.
"S.A.D.D. Distortion"
Shape, Area, Distance, Direction — the four properties that can be distorted by map projections.
"Can Donkeys Fly Past Corn?"
Choropleth, Dot Density, Flow, Proportional Symbol, Cartogram.
Quick Revision Summary
- Maps are symbolic representations of places; cartography is the science of making them.
- Spatial thinking is the ability to visualize and analyze relationships between locations.
- Reference maps show general features (political, physical, road, topographic).
- Thematic maps show specific data (choropleth, dot density, flow, cartogram).
- Topographic maps use contour lines to show elevation — close lines = steep slopes.
- Latitude (parallels) measures N/S of the Equator; longitude (meridians) measures E/W of the Prime Meridian.
- Coordinates: latitude always first (e.g., 40°N, 74°W for New York City).
- Map scale: verbal, ratio, or graphic — shows map-to-reality distance relationship.
- Large scale = small area, lots of detail. Small scale = large area, less detail.
- Every map projection distorts at least one of: shape, area, distance, direction.
- Mercator preserves shape/direction but distorts area. Peters preserves area but distorts shape.
- Robinson is a compromise projection commonly used for world maps.
- GIS layers spatial data for analysis; GPS uses satellites for precise location.
- Remote sensing gathers data from a distance using satellites and aircraft.
- Mental maps are personal, subjective representations of geography.
- Spatial thinking skills: pattern analysis, spatial relationships, scale, direction, change over time.
Frequently Asked Questions
What is the difference between a reference map and a thematic map?
A reference map shows general geographic features and locations (political boundaries, physical features, roads, topography). A thematic map focuses on a specific data set or theme — like population density, climate zones, or trade routes — using special symbols, colors, or shading to illustrate patterns.
Why does the Mercator projection make Greenland look so large?
The Mercator projection preserves shape and direction (great for navigation) but severely distorts area near the poles. Because it stretches landmasses at high latitudes to keep shapes accurate, Greenland (at ~70°N) appears roughly the same size as Africa — even though Africa is actually 14 times larger.
What is the difference between latitude and longitude?
Latitude measures distance north or south of the Equator (0°), with lines running east-west (parallels). Longitude measures distance east or west of the Prime Meridian (0°), with lines running north-south (meridians). When writing coordinates, latitude always comes first: e.g., 40°N, 74°W.
What is GIS and why is it important?
GIS (Geographic Information Systems) is a computer-based system that captures, stores, analyzes, and displays spatial data in layers. It's important because it allows users to overlay different types of data (roads, population, land use, water features) to reveal patterns and relationships — used in urban planning, disaster response, business analytics, and more.
Why is "large scale" a small area and "small scale" a large area?
It's about the fraction in the ratio. A large-scale map (e.g., 1:10,000) has a larger fraction — meaning objects on the map are relatively larger, so you see more detail but cover less area. A small-scale map (e.g., 1:10,000,000) has a tiny fraction — objects are tiny, so you can fit a huge area but lose detail.
Practice Quiz
1. Which type of map primarily shows the boundaries of countries, states, and major cities?
2. What is the imaginary line of longitude that runs through Greenwich, England, and serves as the 0° meridian?
3. A map with a scale of 1:10,000 would typically show:
4. The fundamental problem with creating any map projection is that:
5. Which map projection is known for preserving the accurate relative sizes (area) of landmasses but distorts their shapes?
6. What does a contour line on a topographic map represent?
7. Which geographic tool uses layers of spatial data to analyze and display information?
8. If you are at 23.5°S latitude, you are located on the:
9. Which of the following is an example of a thematic map?
10. The ability to identify clusters, trends, and distributions of phenomena on a map is a key aspect of:
Study Tips for Maps & Spatial Thinking
- Practice reading different map types — compare what you see on political, physical, and thematic maps of the same area.
- Use coordinates daily — look up latitude and longitude of places you know and practice locating them on a globe.
- Compare projections side-by-side — see how the same landmasses look different on Mercator vs. Peters vs. Robinson.
- Draw your own mental map — sketch your neighborhood from memory, then compare with an actual map to see what you missed.
- Explore GIS tools online — free tools like Google Earth let you layer different types of data on real maps.